2025

Pinion SA Blogs and Business Insights | Dairy Benchmarking: Strategic Insights and Critical Trends 2024/2025 in South Africa
Uncategorized

Dairy Benchmarking: Strategic Insights and Critical Trends 2024/2025 in South Africa

The 2024/2025 Dairy Benchmarking exercise, covering farms in the Eastern Cape, Western Cape, KwaZulu-Natal, and Free State, provides a snapshot of a year that tested resilience in South African dairy farming. Most of the farms in this study are pasture-based, operating under diverse production systems, from fully irrigated platforms to dryland setups and include both seasonal and year-round calving herds. From July 2024 to June 2025, producers faced rising input costs, flat milk prices, and unpredictable weather, while global market shifts and geopolitical events added more uncertainty. Despite these challenges, many farms stuck to the fundamentals while also adapting through smarter feed strategies, tighter cost control, and early adoption of technology. At the same time, industry conversations highlighted the need for stronger collaboration and export readiness to stay competitive. Alongside overall trends, we benchmark against the top % of return on total assets and top % of lowest-cost producers, as these farms are best positioned to manage market shocks and maintain profitability. This approach helps identify not only what is typical, but what is possible when efficiency and resilience are prioritized. Benchmarking acts as a business health check, revealing strengths and weaknesses. It helps farms owners and management assess performance through an independent review. In this article, we share the key physical and financial performance trends revealed by our dairy benchmarking analysis and what they mean for dairy businesses planning for the future. Physical KPIs: What Drives Performance Physical performance indicators tell us how efficiently farms turn their resources into milk. In the 2024/2025 dairy benchmarking exercise, most participating farms were pasture-based, operating under diverse systems as touched on in the introduction. This diversity makes benchmarking essential for identifying what works best under different conditions. Key metrics we measured: Units SA Average 23/24 SA Average 24/25 SA Top 25% 24/25* SA Top 10% 24/25* Usable area irrigated % 63 70 82 77 Stocking Rate (Milking Area) cows / ha 3,5 3,6 3,6 3,7 Grazed feed (Milking Area) tdm / ha 12,2 12,5 15,0 16,6 Grazed feed (Total Area) tdm / ha 10,4 10,8 12,9 13,0 Homegrown feed (Total Area) tdm / ha 12,1 12,8 14,1 14,4 Purchased feed energy % % 36 36 32 28 Homegrown feed energy % % 60 61 66 70 Grazed feed energy % % 53 53 62 66 Milk production (Litres) litres / cow 5 770 5 813 5 706 5 800 Milk production (Solids) kg MS / cow 492 500 494 486 Milk solids per kg liveweight kg MS / kg LW 1,07 1,09 1,08 1,00 Labour efficiency cows / labour unit 46 46 50 48 *Top 25% and Top 10% figures represent farms with the lowest cost of production. What we saw: These physical efficiencies are not just operational wins, they form part of the foundation for profitable pasture-based dairy farming. In the next section, we explore how these factors translate into financial performance. Financial KPIs: Profitability Under Pressure Financial performance in 2024/2025 reflected the challenging market conditions, flat milk prices, rising input costs, and environmental variability. Benchmarking against the top 25% and top 10% of lowest-cost producers provides valuable insight into how efficiency translates into resilience from a profitability perspective. *R/Ha figures indicate EBIT per unit of milking area. Units SA Average 23/24 SA Average 24/25 SA Top 25% 24/25* SA Top 10% 24/25* Milk Income cents / litre 731 716 707 716 Total Farm Income cents / litre 769 754 747 754 Total Variable Cost cents / litre 444 461 394 368 Gross Margin cents / litre 325 293 354 386 Total Overhead Cost cents / litre 136 137 137 136 Total Operating Cost cents / litre 580 598 531 503 EBIT (Litre) cents / litre 190 156 217 250 EBIT (Cow) R / cow 10 985 9 031 12 313 14 485 EBIT (Total Area) R / ha 32 715 28 265 38 875 42 255 EBIT (Milking Area) R / ha 38 671 32 936 44 761 52 691 Operating Profit Margin % 25,3 21,2 30,1 35,2 Return on Total Assets % 9,1 7,5 9,9 12,6 Return on Equity % 10,8 9,9 12,5 21,0 *Top 25% and Top 10% figures represent farms with the lowest cost of production. What we saw: Average overhead costs held steady at 136–137 cents/litre, matching top performers. Variable costs primarily caused total operating costs to rise to 598 cents per litre for the average, which was 11% higher than the top 25%. Why Return on Total Assets Matters Up to this point, the paper has benchmarked the average against the lowest-cost producers. While this comparison is valuable, we recognize that cost of production can vary significantly between irrigated and dryland systems. This is why Return on Total Assets (ROTA) is so important. ROTA measures how effectively a farm uses all its assets (land, livestock and infrastructure) to generate profit. It provides a true apples-to-apples benchmark across farms with different resource bases, land values and productive capacities. The graphic below compares the average to the top 10% based on ROTA. Similar to the lowest cost producers, these top performers are highly diverse, ranging from 100% irrigated to 100% dryland operations. The numbers reinforce a key point made earlier: the real differentiator is not the production system, but the ability to execute consistently year after year. *R/Ha figures indicate EBIT per unit of milking area. As South African dairy farming faces rising costs, volatile markets, and climate uncertainty, benchmarking is more than comparative analysis, it’s a strategic compass guiding smarter decisions. Top performers use it to improve year-on-year, leveraging insights that go beyond cost of production to include measures like Return on Total Assets (ROTA), which provide fair comparisons across different resource bases. This year’s analysis shows that efficiency, resilience, and adaptability are not optional, they are the foundation for long-term success. Importantly, the top performers are not concentrated in one region. They include farms from the Free State, KwaZulu-Natal, Fish River, and Tsitsikamma in the Eastern Cape, operating under diverse systems, varying levels of
Pinion SA Blogs and Business Insights | Compliance in South Africa: The Wild Safari You Didn’t Know You Signed Up For
Uncategorized

Compliance in South Africa: The Wild Safari You Didn’t Know You Signed Up For

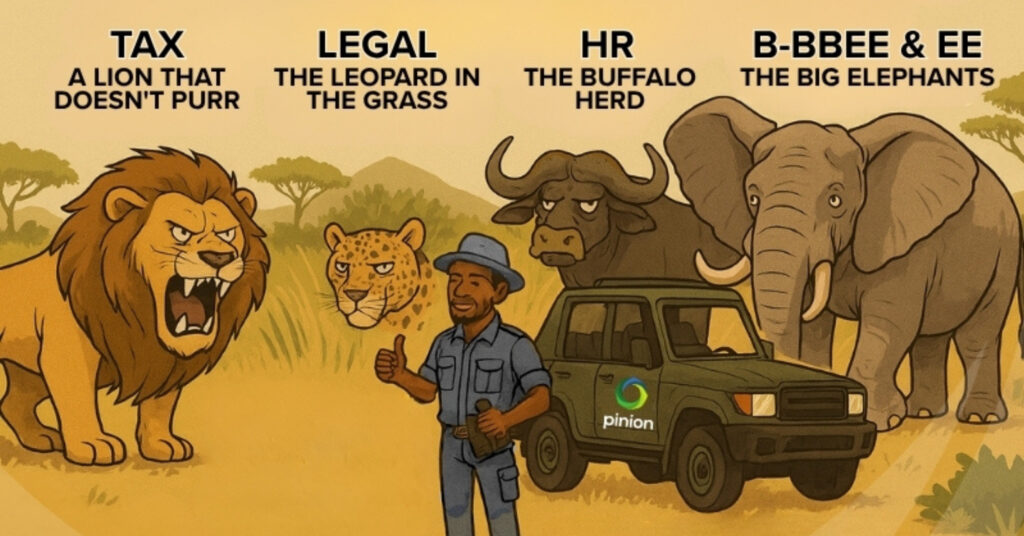
(And why Pinion is your best ranger in the bush.)  If you think business compliance is just a quick tick-box exercise, you’re in for a jol. In Mzansi, compliance is like a Big Five safari – tax, legal, HR, B-BBEE, and Employment Equity (EE) lurking in the bush, ready to moer you if you take one wrong step.  Tax: The Lion That Doesn’t Purr  SARS doesn’t roar – it pounces. Miss a VAT deadline and suddenly you’re coughing up penalties faster than you can say “Eish, my broer!” They don’t play. They’ll chow your profits like a lion on a kudu.  Legal: The Leopard in the Long Grass  Contracts, POPIA, company registrations… sleek and silent until you slip up. One missed clause and you’re in a legal tussle that makes a rugby scrum look like a tea party. Yoh, you’ll wish you had a lawyer on speed dial.  HR: The Buffalo Herd  Payroll errors? Leave chaos? Ignore HR and you’ll have a stampede of WhatsApp messages from staff saying, “Where’s my money, wena?” And trust us, nothing moves faster than a disgruntled employee with data.  B-BBEE & EE: The Big Elephants Big, powerful, and impossible to ignore. These giants shape your business landscape. Get it wrong, and you’re not just losing points – you’re losing opportunities, tenders, and credibility.  So, Why Pinion?  Because going into the compliance jungle alone is like hitting Kruger in a Citi Golf with a packet of Nik Naks. Pinion is your fully kitted 4×4 with a seasoned ranger who knows every track, watering hole, and sneaky hyena.  We keep SARS happy so you can sleep lekker. We make legal compliance less scary than a leopard in the dark. We tame HR chaos before it turns into a WhatsApp war. We guide you through B-BBEE and EE so you don’t get trampled by the elephants.  Ready to stop guessing and start winning? Call Pinion today. Because in the compliance bushveld, survival isn’t about luck – it’s about having the right guide. And we’ve got the map, the muscle, and the biltong!  Visit our website or contact info@pinionza.com for more information.

Pinion SA Blogs and Business Insights | Safe Farming, Strong Future Campaign: Department of Labour Audit Preparation: Stay Compliant and Avoid Penalties – What Farmers Need to Know
Uncategorized

Department of Labour Audit Preparation: Stay Compliant and Avoid Penalties – What Farmers Need to Know

What to Expect, How to Prepare, and How Our Company Helps You Stay Compliant For many farm employers, the thought of a Department of Labour Audit can feel overwhelming. Inspectors arrive to assess compliance with the Occupational Health and Safety Act (Act 85 of 1993), and if gaps are found, the consequences can be serious—ranging from fines and notices to potential work stoppages. The good news? With preparation, you can turn an Department of Labour Audit into an opportunity to demonstrate your commitment to safety, protect your workers, and build credibility as a responsible employer. What is a Department of Labour Audit? A Department of Labour Audit is an official inspection carried out to ensure that your farm or agricultural operation complies with workplace health and safety legislation. The inspector’s role is not just to find faults—it’s to verify whether your systems are in place to protect workers from harm. During a Department of Labour Audit inspectors typically: What Inspectors Commonly Ask For Being caught off guard is often the biggest cause of stress during an audit. Knowing what inspectors usually request will help you prepare in advance. Expect them to ask for: Failure to produce any of these documents may raise red flags, even if your farm is otherwise safe. How to Prepare for an Audit Preparation is the key to passing a Department of Labour Audit with confidence. Here’s what you should do: By taking these proactive steps, you reduce risks and demonstrate a genuine commitment to worker safety. Training Video Resource For a practical look at what to expect during a Department of Labour Audit, we recommend this short training video: ▶️ Watch: Preparing for a Health and Safety Inspection It provides a clear overview of what inspectors typically check, and how to ensure your site and documents are in order. How Pinion SA Can Help Preparing for a Department of Labour Audit on your own can be stressful, especially if compliance isn’t your everyday focus. That’s where we come in. We make the process simple and manageable by offering: ✔ Pre-audit inspections and gap analyses to identify problem areas before the Department arrives.✔ Compilation or updating of your complete Health & Safety File.✔ Assistance with all legal appointments, including Section 16.2, Health & Safety Reps, and First Aiders.✔ Guidance on corrective actions and documentation.✔ On-site support during the Department of Labour inspection. With our expertise, you won’t just pass your audit—you’ll strengthen your overall safety culture. Are you worried about an upcoming inspection? Don’t wait until inspectors are at your gate to realise your files or systems aren’t ready. Let our company help you prepare, stay compliant, and build a safer future for your farm. Contact us today for a free compliance check—and pass your Department of Labour Audit with confidence. Visit our website or contact info@pinionza.com for more information.

Pinion SA Blogs and Business Insights | Safe Farming, Strong Future Campaign: PPE and Training: Safety Without Shortcuts – What’s Required and How to Track It
Uncategorized

PPE and Training: Safety Without Shortcuts – What’s Required and How to Track It

One of the most practical yet often overlooked aspects of farm safety is Personal Protective Equipment (PPE) and training. Farming is a high-risk environment with machinery, chemicals, livestock, and unpredictable weather conditions all creating potential hazards. Without the right protective gear and adequate training, workers face preventable injuries, illnesses, and even fatalities. For employers, this also means potential liability, penalties, and reputational damage.

Pinion SA Blogs and Business Insights | Safe Farming, Strong Future Campaign: Essential Legal Appointments on Farms
Uncategorized

Essential Legal Appointments on Farms

This guide explains the essential legal appointments required under the Occupational Health and Safety Act (Act 85 of 1993) and relevant regulations. These appointments ensure that health and safety responsibilities are delegated to competent individuals who can manage risks on the farm.

Pinion SA Blogs and Business Insights | Safe Farming, Strong Future Campaign: Build Your Health & Safety File
Uncategorized

Build Your Farm Safety File

A compliant safety file isn’t just about ticking boxes — it’s about protecting your people, your operation, and your livelihood. One of the most important tools in achieving this is your Health & Safety File.

Scroll to Top